What data does TraceTogether really track?
Written on April 10th, 2020 by Yu Jia Cheongsingapore exploratory data analysis TraceTogether
In the midst of the COVID19 crisis, the Singapore government has developed an app called TraceTogether, on which much ink has already been spilt. The goal of the app is to aid in contact tracing by keeping track of people you might come into close contact with unknowingly (for example, on the train, at a hawker center) via tracking bluetooth signals. I won’t go into more detail on how the app works or on privacy concerns since those are not really my areas of “expertise”, but merely be content with examining the data collected in my TraceTogether app.
As I had never extracted data from my phone before, I found the instructions from the last link above was pretty helpful. The app data extracted using adb contained several sqlite databases, but the two relevant ones were record_database and trace_together_status. The author of the post used a kibana dashboard and an Elasticsearch database to visualize their data, but while I was familiar with manipulating Grafana dashboards from work, I had never set a server up by myself before. I thus decided to get onto more familiar ground by exporting the relevant extracted sqlite database as a csv file to examine it in a standard jupyter notebook.
At the time of extraction (7 April 2020), I had installed the app for a little more than 2 weeks (21 March 2020), during which time I was mostly working from home (and had my bluetooth off), with a few outings for meals with friends and to the gym (pre “Circuit Breaker” measures) (for which I turned bluetooth back on).
Data
Here are the first few lines of data from the record_database:
| id | timestamp | v | msg | org | modelP | modelC | rssi | txPower |
|---|---|---|---|---|---|---|---|---|
| 1 | 1585305371488 | 1 | 2k7qJ… | SG_MOH | Pixel | SM-N960F | -69 | nan |
| 2 | 1585305437590 | 1 | TsPI8… | SG_MOH | Pixel | SM-G935F | -75 | nan |
| 3 | 1585305455172 | 1 | duEIK… | SG_MOH | Pixel | Pixel 3 XL | -76 | nan |
| 4 | 1585305488374 | 1 | PpPIg… | SG_MOH | Pixel | SM-G960F | -87 | nan |
| 5 | 1585305498986 | 1 | 2k7qJ… | SG_MOH | Pixel | SM-N960F | -65 | nan |
Right away we can figure out what some of these columns mean:
- id is simply an increasing index
- timestamp is in standard UNIX time (number of milliseconds since 1 Jan 1970 midnight UTC)
- v is always 1
- msg is an encrypted identification of the other party encountered (probably the phone number?)
- org is always “SG_MOH”
- modelP is my phone (Pixel)
- modelC is the model of the other phone encountered (as read elsewhere, probably tracked to aid in app debugging purposes)
- rssi is Received Signal Strength Indicator, which when in negative form represents a stronger signal the nearer to 0 it is.
- txPower is mostly NaNs, with a few ones sprinkled in between, not too sure what this can be - battery power consumed by transaction?
First things first - let’s convert that timestamp into a more readable form. When I first tried to piece together where I was for each of the groups of entries, I couldn’t figure out why there were entries at 10.30am when I was ostensibly working from home. Digging a little deeper, I realized that there were also entries at midnight when I was definitely at home and asleep - so something was definitely up! The answer is actually pretty simple - the timestamps were saved in UTC, so I needed to add 8 hours to it for the data to make sense in Singapore time. Keeping only the interesting columns and adding a quick parser on the phone model to get the brand of the phone:
| timestamp | msg | modelC | modelC_parsed | rssi |
|---|---|---|---|---|
| 2020-03-27 18:36:11.488000 | 2k7qJ… | SM-N960F | Samsung | -69 |
| 2020-03-27 18:37:17.590000 | TsPI8… | SM-G935F | Samsung | -75 |
| 2020-03-27 18:37:35.172000 | duEIK… | Pixel 3 XL | Pixel | -76 |
| 2020-03-27 18:38:08.374000 | PpPIg… | SM-G960F | Samsung | -87 |
| 2020-03-27 18:38:18.986000 | 2k7qJ… | SM-N960F | Samsung | -65 |
Doing the same thing for the trace_together_status database, we see that it keeps a record of when scanning starts and stops. I converted these strings into 1s and 0s, for when TraceTogether was and wasn’t scanning.
| id | timestamp | msg |
|---|---|---|
| 1 | 2020-03-21 11:48:26.902000 | Scanning Started |
| 2 | 2020-03-21 11:48:34.837000 | Scanning Stopped |
| 3 | 2020-03-21 11:48:52.103000 | Scanning Started |
| 4 | 2020-03-21 11:48:55.535000 | Scanning Stopped |
| 5 | 2020-03-21 17:40:50.266000 | Scanning Started |
Number of Encounters
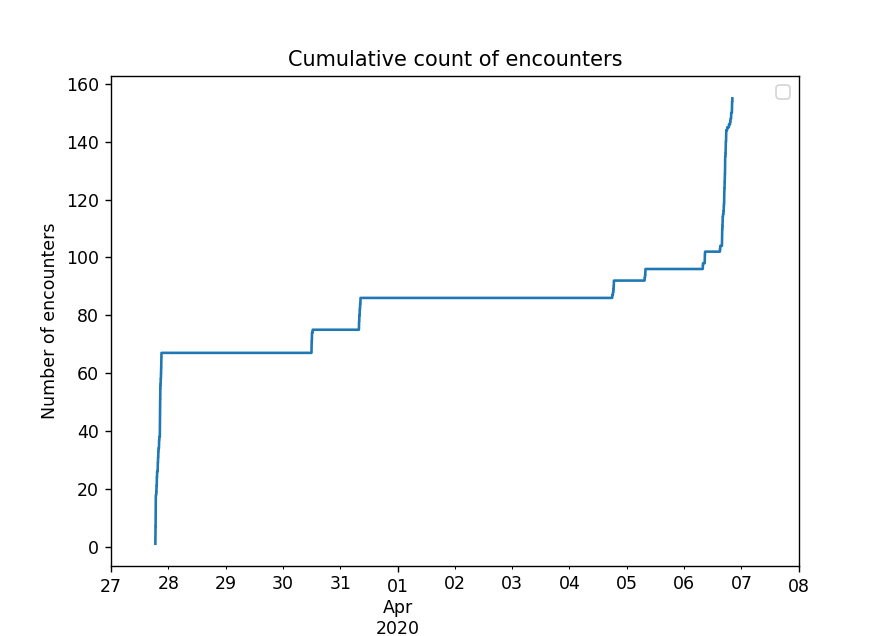
Each entry in the record_database is a recorded ping from another phone, therefore the total number of entries in the database (248 in all) would include multiple entries from the same individual encountered. Since the encrypted identifiant in the ‘msg’ column is unique for each individual, a groupby by date and ‘msg’ would give us the total number of unique encounters I had. Grouping by date would enable us to account for the possibility of running into the same person twice on different days. This leaves me with 155 unique encounters.
Doing this, of course, subsequently holds the assumption that all entries with the same individual was not encountered more than once in the same day under separate occassions. Since on most days I was only going out once, this assumption was valid on my dataset. In fact, there were no repeated encounters in my set of data - each individual encountered only had one block of ping exchanges with me. This was to be expected as I did not meet friends or colleagues more than once over this period of time, and did not turn on TraceTogether at home.
Indeed the cumulative plot of the total number of unique encounters over the 15 days or so shows just how rarely I was out - most of the increments happen by leaps and bounds with long periods of no new encounters.
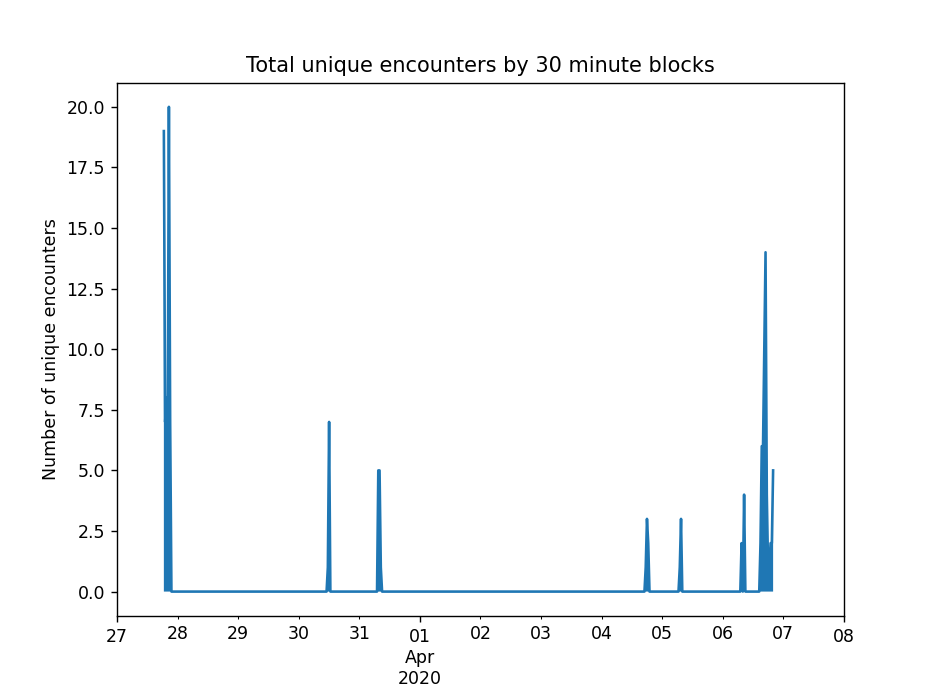
To get a sense of the density of encounters (just how many people were pinging my phone at one time?), we can also look at the total number of unique encounters per 30 minute blocks. From this graph, each outing of mine is made pretty clear! (30 minutes was chosen at random, we would have a similar but shorter graph for shorter blocks of time)
Length of Encounters
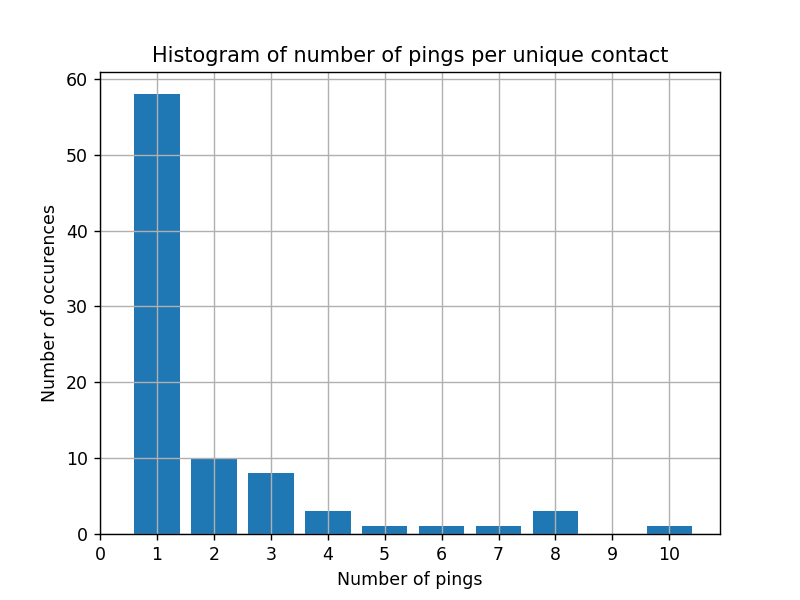
The number of people I come into contact with is less interesting than knowing how long I was in contact with them and at what “proximity”. Let us look at the number of pings recorded each time I encountered another individual. Since I had made sure that I did not come into contact with the same individual on multiple days, I simply did a groupby on the ‘msg’ column for this.
Making the (reasonable) assumption that each encounter is continuous, we can further find the length of the encounter by looking at the difference between the timestamps of the first and last ping per individual.
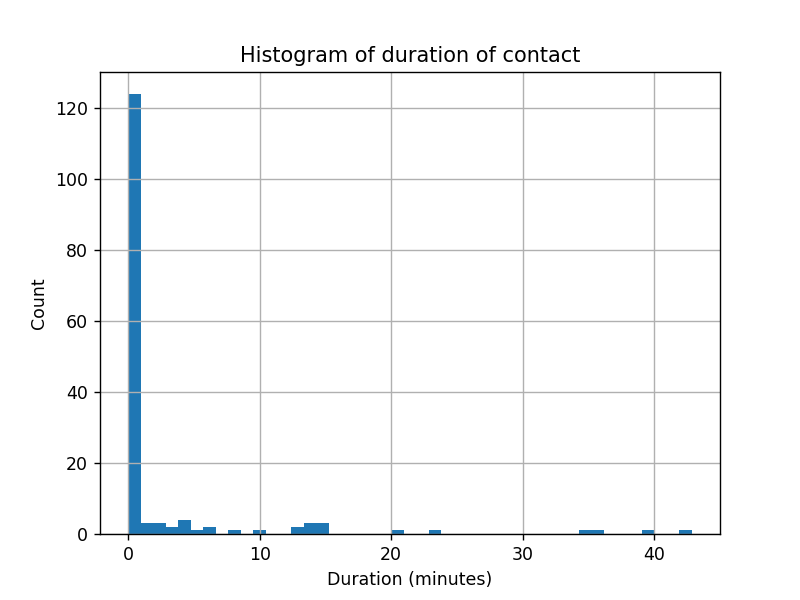
As can be expected, most encounters were short ones with only one ping, and lasted less than a minute. There is a pretty long tail though - with the longest encounter lasting slightly above 40 minutes!
Signal Strength
Unfortunately, as the RSSI signal doesn’t have standard units, I am unable to calculate the distance of the other party from my phone simply based on the RSSI data. The data can however give me a sense of how these distances are distributed. Here, I take the average RSSI per encounter with each individual to remove the bias of longer encounters having more than one data entry.
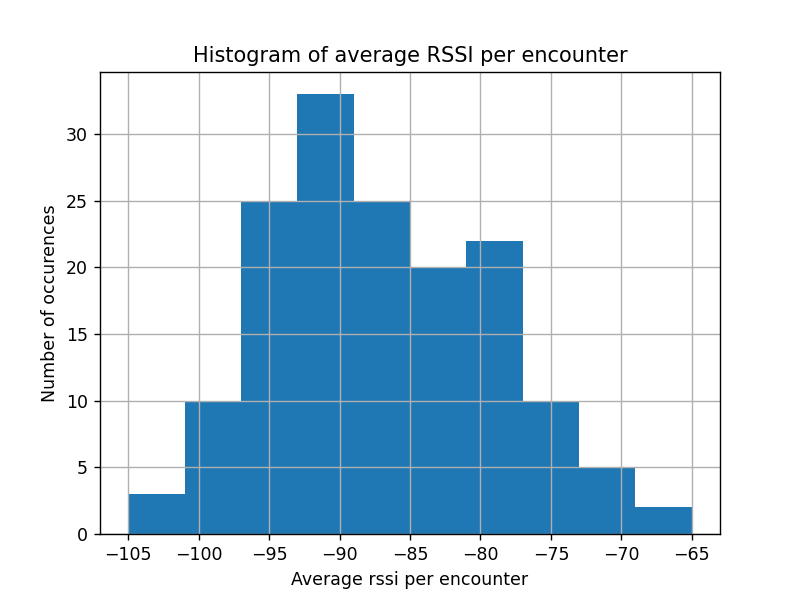
A pretty normal distribution, centered around -90 to -85, perhaps with a slight skew to the left (more people who were far than who were near). I’m not quite sure what the cutoff would be for the contact tracing team to consider someone to have been in close contact with you both in terms of proximity and length of duration though.
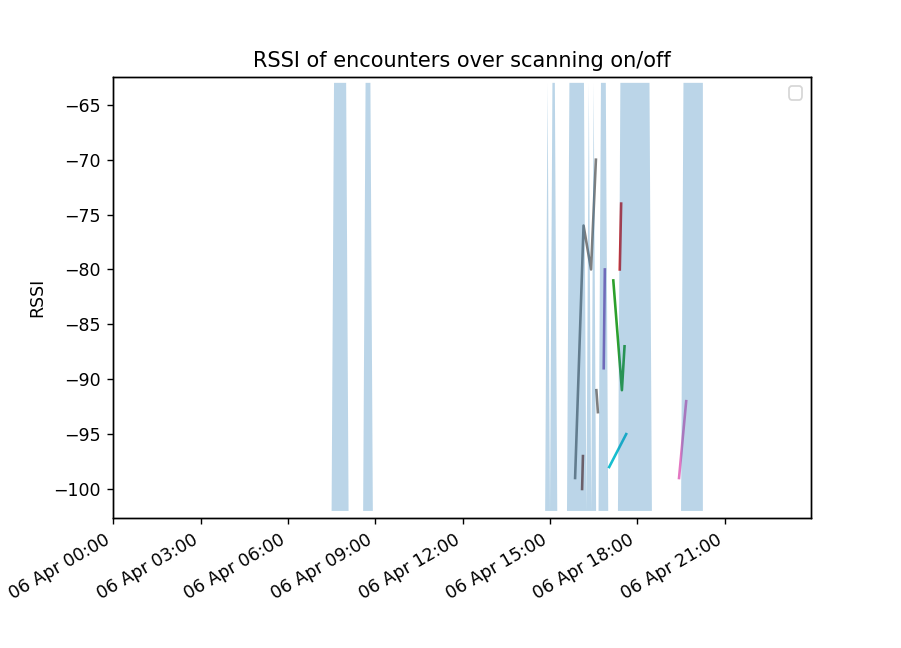
What we can do however is to plot the received signal strength of each individual with a different colour to get a sense of how different people moved around me (my phone) each time I turned my bluetooth on. A dinner at Clementi hawker center and subsequent quick jaunt in a supermarket with three friends looks like this:
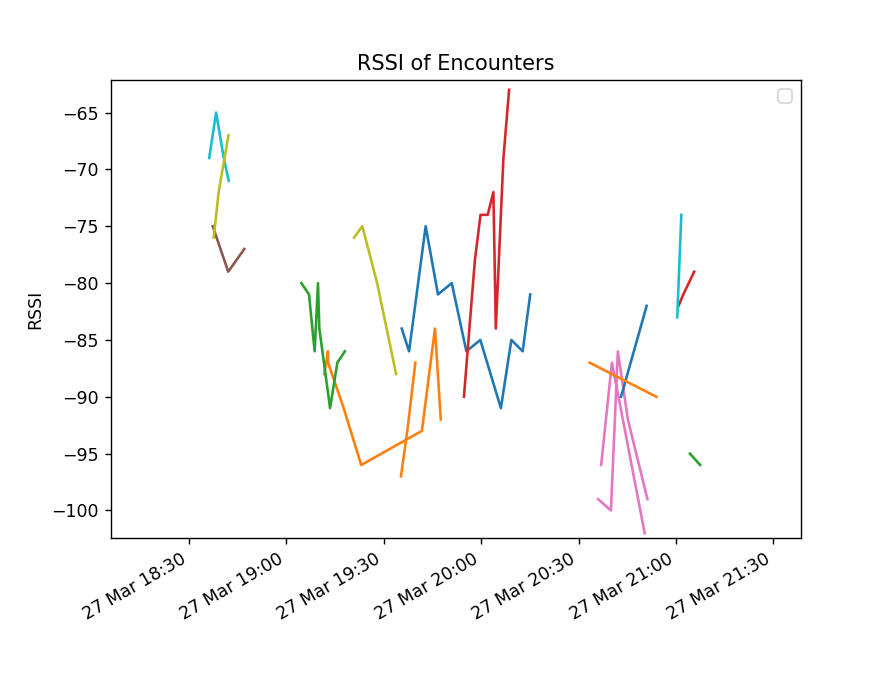
This outing contained the longest encounter I had of 45 minutes (the blue line from 7.30pm to about 8.15pm). I suspect that this was one of my friends as within this time frame we were moving from the hawker center to the supermarket, and it seems unlikely that someone else would have been doing the same thing! (unfortunately he has yet to confirm or deny his phone model so I can’t be sure - my two other friends do not use the app though.)
As for a morning HIIT session at my gym, where we are normally less than 10 per class and my phone was left in my bag at the side of the room:
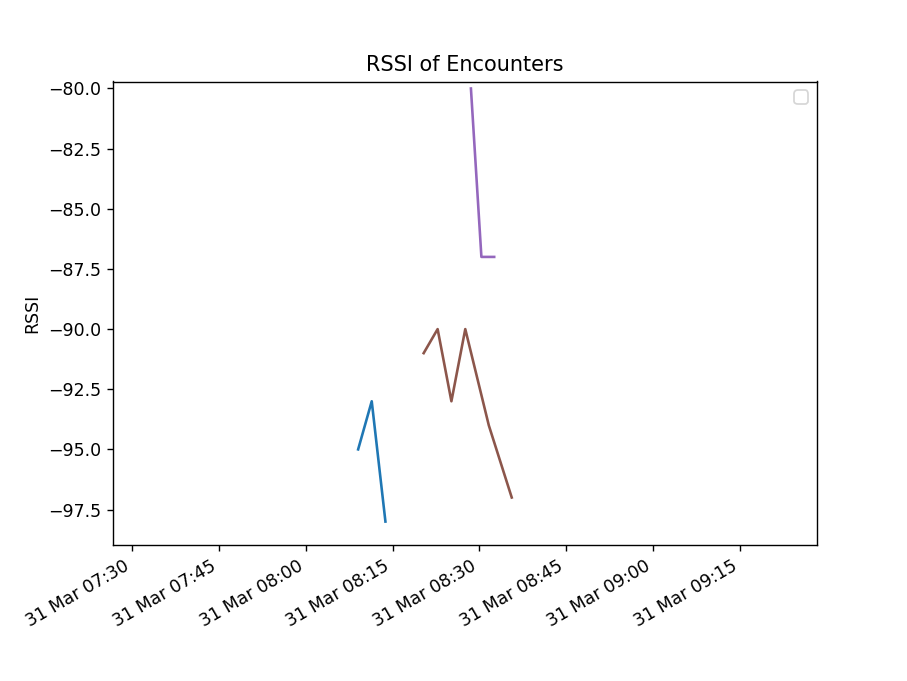
Clearly a lot less activity!
Plotting the rssi of each encounter over a background of when scanning started and stopped (blue when scanning, white when stopped), we see the following:
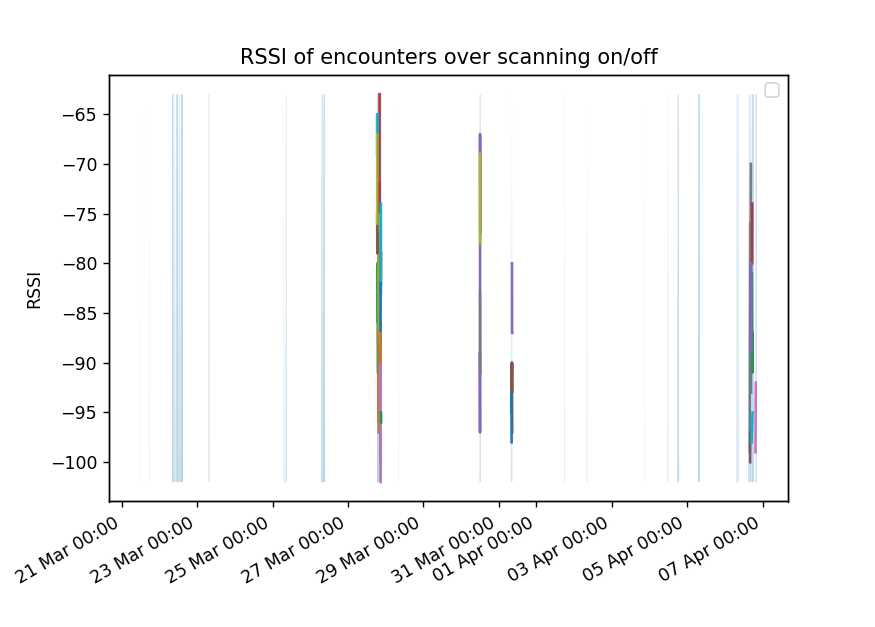
Evidently, there were quite a few times when TraceTogether was scanning but no pings were received. Zooming into one day:
This was the last day before Circuit Breaker officially started, when I was in the gym in the morning (no pings), and when in the afternoon I headed back to my office and was camped outside to work in between time to alternate time in the office with my colleague (multiple pings) - my brother being in a good mood on this particular day, I was dropped off by car, and subsequently walked home in the evening, so no time spent on public transport either.
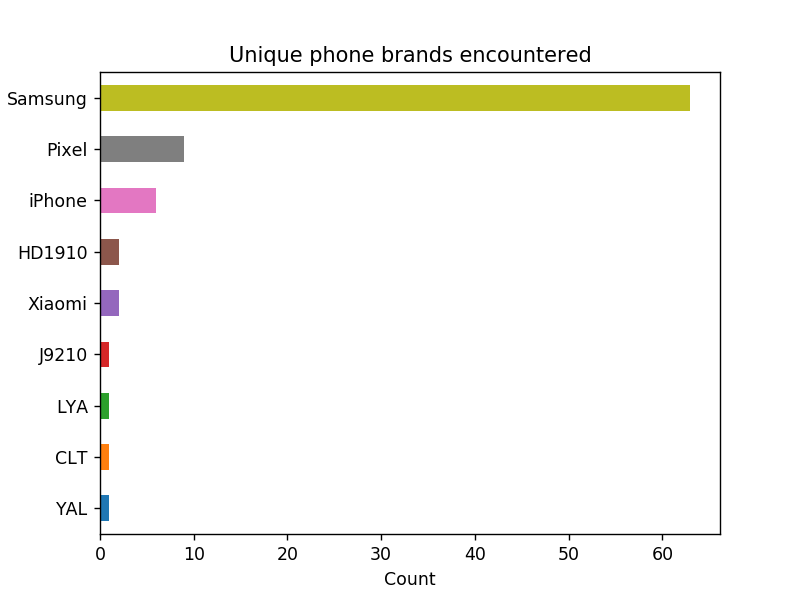
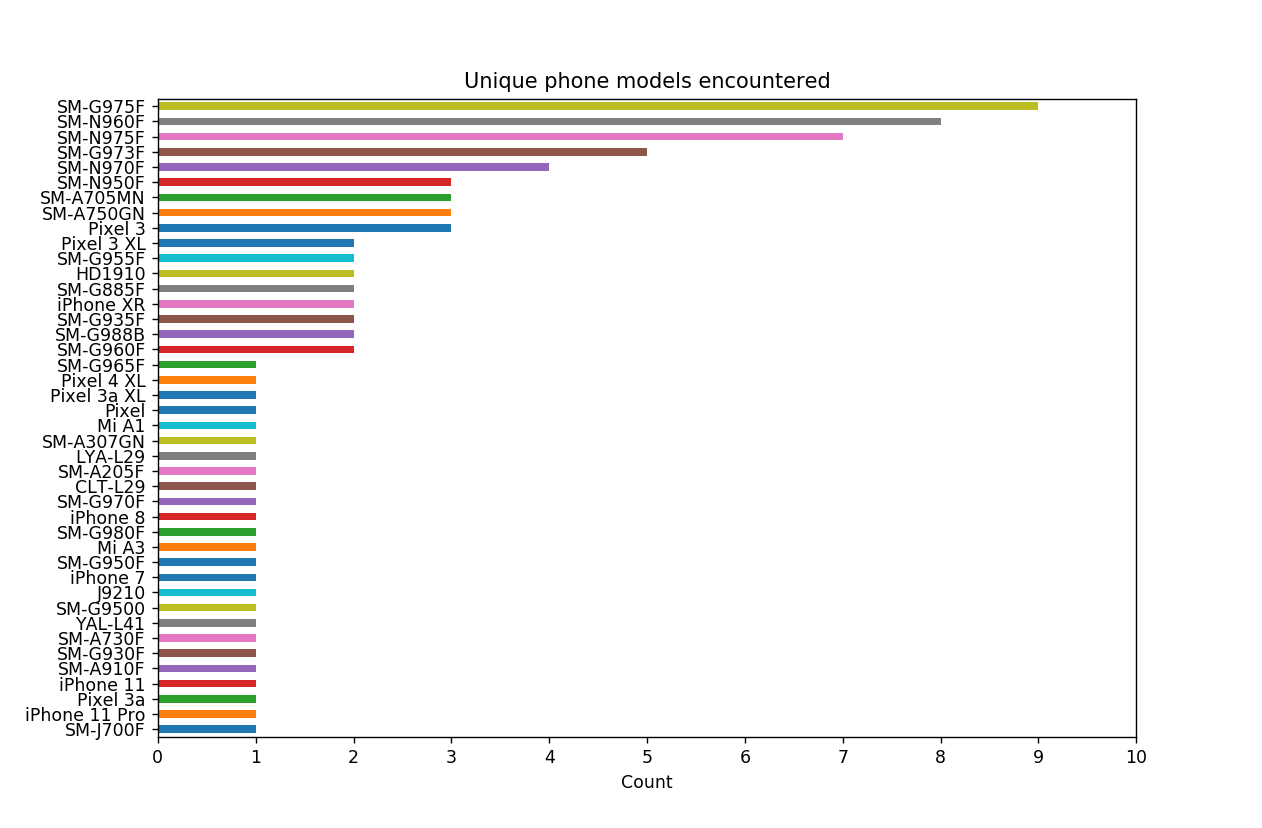
Phone Models
Others who’ve extracted their data have also looked at the different phone models encountered. From my data, Samsung appears to have a disproportionately large amount of TraceTogether users, and this is in line with observations from others too. This is likely due to complications of using the app with iPhone resulting in slower uptake among iPhone users (complications such as having to keep it in the foreground, having to keep the screen on - if not for the latest version of the app, at least at the start). I did not expect to see that many Pixel users too!
Conclusion
Is TraceTogether really useful in tracing contacts? I would say that it’s main utility is indeed not so much in helping you remember which friends you met but to track the casual strangers you might come into close contact with. This little exercise has served to highlight just how many unknown people I come into contact with in just one outing - especially knowing that the data represents just a small portion of the actual number of people I would have met!
I suspect that the app would have been a lot more helpful if it had been more widely installed at an earlier date, unfortunately, with the standard government-as-panopticon concerns, this might have been hard to put into place. Full access to such data over a long period of time from every resident in the country would certainly allow tracking of who each person met and potentially where they went too - I imagine that “geographical clusters” can be formed if we drew a graph linking every two individuals who had met each other.
That being said, I would also think that there would be a lot of noise for data collected over a shorter time frame - I’d probably meet a friend as often as I do another regular at the gym with whom I’ve never spoken a word, and it’d be hard to differentiate one data point from the other. Furthermore, if you were indeed carrying out suspicious business, you could probably just turn off your bluetooth or better yet, leave your phone at home.